Coffee Sales Dashboard: Brewing Up Data-Driven Decisions#

Project Purpose#
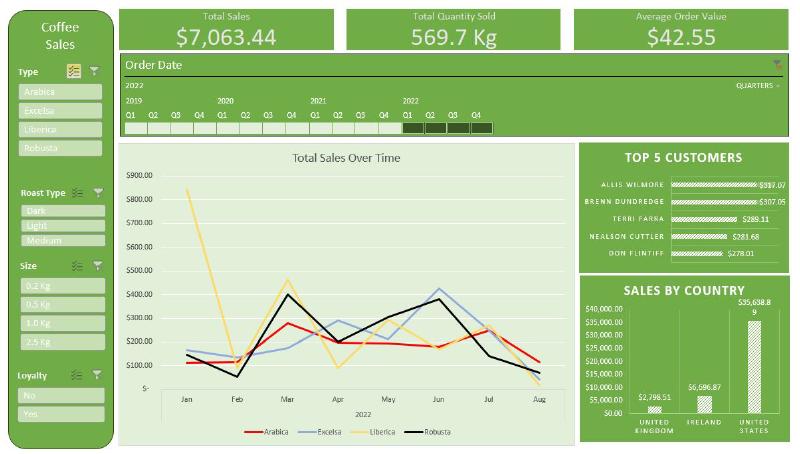
This project aimed to create an intuitive, data-driven dashboard providing real-time insights into coffee sales. The dashboard empowers the business team to track key performance metrics, such as sales volume, revenue, and product performance, enabling informed decision-making and improved business strategy.
Key Features & Insights:#
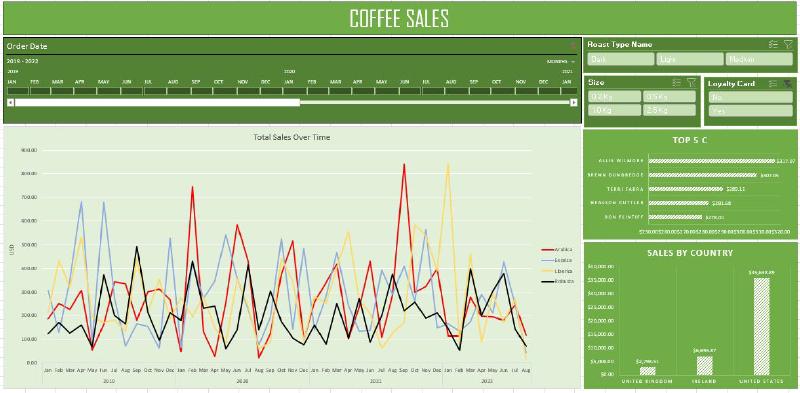
- Sales Volume & Revenue Visualization: Clearly visualize sales volume and revenue trends over time, allowing for easy identification of peak sales periods and areas for improvement.
- Product Performance Analysis: Analyze the performance of individual coffee products, identifying top sellers and underperforming items.
- Monthly Filtering: Filter data by month to analyze sales trends and performance on a monthly basis.
Process#
- Data Acquisition & Preparation: Acquired from Github repo
- Dashboard Development (Excel Tableau): The interactive dashboard was designed and developed in Excel and redesigned for Tableau.
Tools Used:#
Excel (Data Prep and Visualization), Tableau
New Revisions#
This is the second version of the dashboard in excel